Tamara- AP Physics
Acceleration: Free Fall Lab
Purpose: Measure the acceleration of a stack of coffee filters. In our case, we did this by camera measurement.
Equipment: Stack of coffee filters
camera
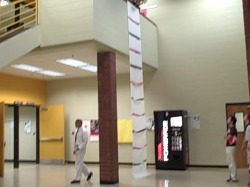
Long sheet of paper that measures 5.4 meters off the staircase
meter stick
LoggerPro
camera
Long sheet of paper that measures 5.4 meters off the staircase
meter stick
LoggerPro
Procedure:
The independent variable in our experiment was time. We used the camera and filmed the drop and used the computer to go frame-by-frame and measure the distance. We used the same mount of coffee filter each time which made that variable constant. Each time we changed the height from which the filters were dropped. At first, we dropped the filters from the grand staircase(5.4 meters) and then we did the same from 70 cm. We then used movie-maker to conclude the height at a certain time(s). This gave us the numbers to plug into LoggerPro to produce a graph.
The independent variable in our experiment was time. We used the camera and filmed the drop and used the computer to go frame-by-frame and measure the distance. We used the same mount of coffee filter each time which made that variable constant. Each time we changed the height from which the filters were dropped. At first, we dropped the filters from the grand staircase(5.4 meters) and then we did the same from 70 cm. We then used movie-maker to conclude the height at a certain time(s). This gave us the numbers to plug into LoggerPro to produce a graph.
Data:
Data for 5.4m drop
Time (s) Distance (m)
0 0
0.27 0.3
0.4 0.9
0.54 1.3
0.67 1.9
0.8 2.7
0.94 3.5
1.07 4.4
1.2 5.1
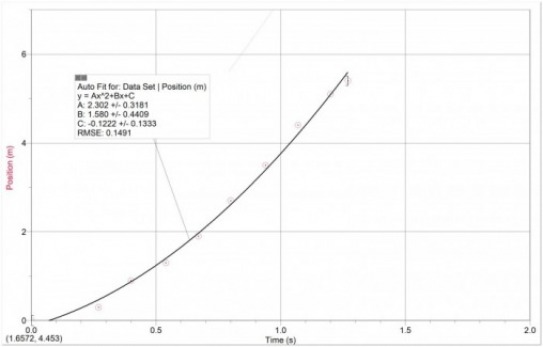
1.27 5.4 Position vs Time at 5.4 meters
Data for 5.4m drop
Time (s) Distance (m)
0 0
0.27 0.3
0.4 0.9
0.54 1.3
0.67 1.9
0.8 2.7
0.94 3.5
1.07 4.4
1.2 5.1
1.27 5.4 Position vs Time at 5.4 meters
Data for 70 cm drop
Time (s) Distance (cm)
0 0
0.07 15
0.13 22
0.2 42
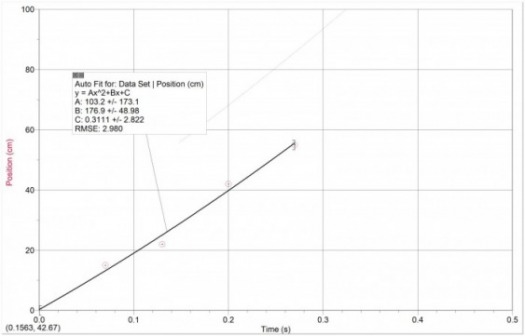
0.27 55 Position vs Time at 70 cm
Time (s) Distance (cm)
0 0
0.07 15
0.13 22
0.2 42
0.27 55 Position vs Time at 70 cm
Data Analysis:
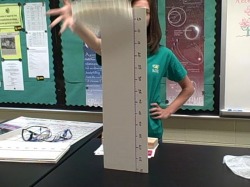
These graphs are position vs time graphs which means that to get the acceleration of the object, i would have to convert these graphs to velocity vs time and take the slope. That is a very inconvenient way of doing this when i can find the equation of the position vs time graphs and take the second derivative to give me the acceleration. Obviously the coffee filters were accelerating as they got closer to the ground, as the graphs show. Gravity is our acceleration. The pictures below show the process of obtaining our measurements.
These graphs are position vs time graphs which means that to get the acceleration of the object, i would have to convert these graphs to velocity vs time and take the slope. That is a very inconvenient way of doing this when i can find the equation of the position vs time graphs and take the second derivative to give me the acceleration. Obviously the coffee filters were accelerating as they got closer to the ground, as the graphs show. Gravity is our acceleration. The pictures below show the process of obtaining our measurements.
Conclusion:
We determined the position vs time graphs of the coffee filters which gave us the acceleration by a few computations. Gravity is pulling the coffee filters down with an acceleration of 9.8m/s^2. We did have some problems with the blur for measurements from the video. That is the source of our error. The video was not clear enough and blurred the coffee filters. Also, the 5.4 meter "ruler" was the same color as the coffee filter so we tried our best to defer between the two. The video was not the most precise, but it is the most convenient. The motion detector was probably a better choice, but the video was more practical for the distances measured.
We determined the position vs time graphs of the coffee filters which gave us the acceleration by a few computations. Gravity is pulling the coffee filters down with an acceleration of 9.8m/s^2. We did have some problems with the blur for measurements from the video. That is the source of our error. The video was not clear enough and blurred the coffee filters. Also, the 5.4 meter "ruler" was the same color as the coffee filter so we tried our best to defer between the two. The video was not the most precise, but it is the most convenient. The motion detector was probably a better choice, but the video was more practical for the distances measured.
