Tamara- AP Physics
Lab: Interpreting and Matching Displacement vs. Time Motion Graphs
Objectives:
- Create a Displacement vs. Time graph.
- Gain competence in the use of motion detector and related equipment.
- Understand the relationship between position vs. time, velocity and acceleration.
Materials:
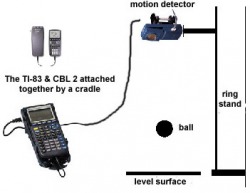
TI-84 Calculator-Based Lab Unit (CBL-II)
Motion detector
Meter stick
Computer with LoggerPro software
Procedure:
Part I –
1. Develop a position vs. time story that describes a body in motion incorporating at least the following four types of motion.
i. standing still
ii. moving with constant velocity
iii. moving with variable negative velocity
iv. moving with variable positive velocity
2. Illustrate the story on a position vs. time graph. Use a legend to cross reference sections of the graph with the corresponding sections of the story.
3. Underneath the graph, write instructions for another lab group to move according to the graph you have drawn (see page 2 for example).
Part II – AT THE LAB STATION IN CLASS WITH A PARTNER
4. Exchange graphs with another lab group. Each participant should read and interpret each other’s graphs to understand how to move. Measure out and mark meaningful locations on the floor and practice the motion.
5. Now it’s time for you to match your physical motion to another group’s descriptive motion graph. You have 3 attempts to match it as best you can. Save a copy best graph your motion creates and reproduce this graph using LoggerPro. See Mrs. Geddes if you need instructions for uploading data to LoggerPro.
Motion instructions for partner: (Sample Example)
A) Start with your back to the sensor at a position 2 meters away from the motion sensor.
B) For the first two seconds, walk backwards toward the motion sensor with slow constant velocity and stop 0.5 m from the sensor.
C) For t=2 to t=4, accelerate forward away from the sensor stopping at 3 m from the sensor.
D) Stop for 1 second, then go backwards 2 meters in 1 second at a constant velocity.
E) etc.
Data/ Analysis:
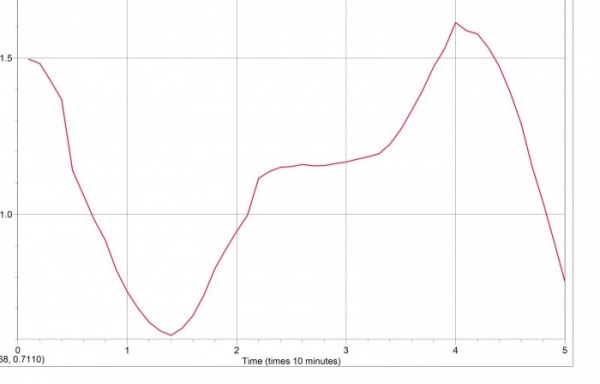
Tamara’s Adventure
1. Tamara arrives at the park and begins her refreshing morning run and travels 1.5 miles before realizing that she is lost.
2. Then she begins to jog in the opposite direction for 1.2 miles
3. Then, Tamara become tired and must stop and rest for 25 minutes.
4. Tamara soon encounters a dog that proceeds to chase her for .5 miles.
5. To try to lose the dog, Tamara changes direction and runs at varying speeds for another 1.5 miles before the dog loses interest and goes away. Tamara has a long walk home.
Graph at the bottom of the page.
Instructions for the motion detector:
Stand about 5 feet in front of the motion detector. Move forward at a constant rate for 1.5 seconds. Then, move backwards half the first distance at a constant speed for .75 seconds. Stand still for 1.25 seconds, then move away from the detector for .5 seconds. Finally, go towards the motion detector at a varying speed.
Conclusion:
The position vs. time graph was very difficult to recreate with the motion detector. The motion detector was very sensitive to our every movement, so the recreated graph is not exactly what we originally thought it was going to be. The error in our LoggerPro graph is merely human error because we cannot stand completely still after moving as quickly as needed. Also, we could not produce exactly the same speed during the correct amount of time as necessary. This is as close as we got to our intended graph. The graph teaches you how velocity and acceleration are different.
Tamara's Adventure- Position vs Time graph
(y-axis in miles)